
Cognitive Tasks
M-USE contains prebuilt, customizable tasks testing Working Memory, Visual Search, Reward Learning & Set Shifting, Visuospatial Problem Solving, Temporally Ordered Item-Item Paired-Associate Learning, Effort Control & Motivation, and Continuous Recognition
Continuous Recognition Task (CR)
Purpose
The Continuous Recognition task measures how well subjects update and maintain their working memory of objects, and how well they use their working memory to choose novel objects in their environment.
Description
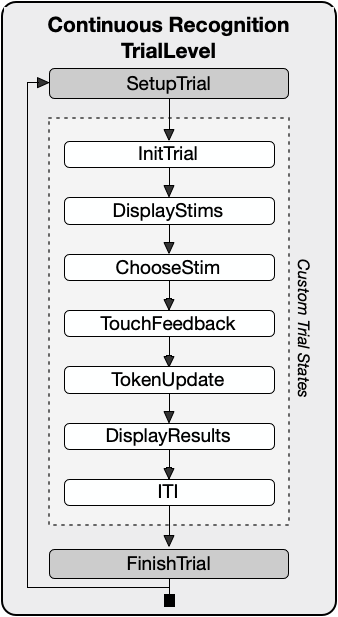
The task displays unique objects on the screen each trial, and the subjects objective is to select an object they haven’t previously chosen. The total number of objects increases each trial, and the objects are a combination of New, Previously-Chosen (PC), and Not-Previously-Chosen (NPC) objects. The block ends when the subject selects an object they’ve chosen in a previous trial.
Task Demo
State Structure
Metrics
Performance of the Continuous Recognition task provides one main metric. The average number of correctly chosen objects before committing an error describes the ‘WM updating’ ability (1). The updating metric can be extended in multiple ways. For example, a novelty bias for updating can be inferred from the difference of the proportion of correct choice on new (N) versus not-previously chosen (NPC).
Effort Control Task (EC)
Purpose
The Effort Control task measures how motivated subjects are to work for a reward.
Description
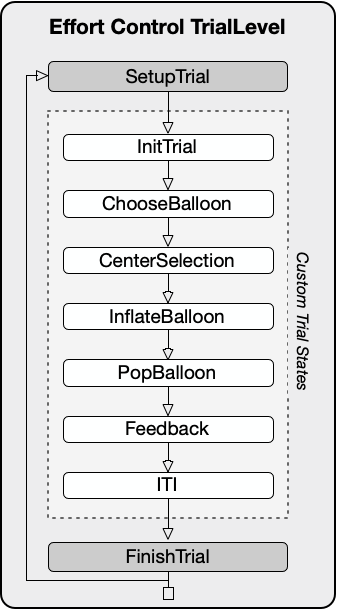
The task presents the outlines of two balloons that can be pumped up until they pop. Subjects chose one of the two balloons, which differ in both the number of touches needed to pop the balloon (effort) and the number of tokens gained for popping the balloon (reward). The effort and reward amounts vary systematically in order to evaluate how much reward a subject needs to be motivated to choose the more effortful balloon option.
Task Demo
State Structure
Metrics
Performance of the Effort-Control task provides two metrics. A first metrics is the motivational break-point that described the maximal amount of effort (balloon outlines) over the expected reward outcomes (numbers of tokens) that lead a subject to avoid choosing that option over the alternative option (1). The break-point computation also entails an estimate of the subjective value of the chosen side as an ‘expected utility’ metric that reflect the ratio of expected benefits (amount of tokens) and costs (number of balloon outlines). As a secondary metrics the Effort Conrol task allows estimating the ‘motivational vigor’ as the average duration of pumping up a balloon normalized by the number of outlines/pumps needed to explode it (2).
Flexible Learning Task (FL)
Purpose
The Flexible Learning tasks measures how fast and accurate subjects learn new attention sets. It also measures various cognitive constructs underlying cognitive flexibility, including the degree of perseverative responding, and the cognitive control costs of switching an attention set from one rewarded feature to a new feature of the same feature dimension (intra-dimensional shifts), or to a feature of a different feature dimension (extra-dimensional shift).
Description
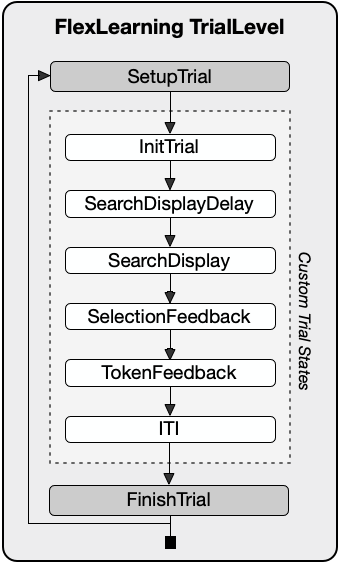
Subjects have to identify which of three objects provide the most token gains (reward). In blocks of 30+ trials, the maximal token gain is associated with one specific visual feature that defines only one of the objects, while the other objects have distracting features of the same and different dimensions (e.g. colors, shapes, patterns). The task varies the number of distracting feature dimensions, and the number of tokens gains or lost for correct and erroneous choices, respectively. The task allows quantifying the number of trials needed to reach a learning criterion and it measures different error types that indicate whether subjects persevere on previous reward rules or follow suboptimal strategies.
Task Demo
State Structure
Metrics
Performance of the Flex-Learning task provides five metrics. The speed of ‘object-value learning’ (1) corresponds to the time to reach criterion performance defined as the first trial leading on average to 75% correct performance over a forward looking 10-trial window. Learning speed indexes cognitive flexibility and comprises multiple subfunctions that this and other tasks tap into. Comparison of the learning speed for blocks with different gains indexes reward sensitivity (2) and for different losses indexes loss sensitivity (3). Flex-Learning allows quantifying error monitoring for avoiding perseveration of choosing a non-rewarded object (4), using a previous-trial analysis that measures the accuracy in the trials after an error trial (ECn analysis). The ECn analysis allows quantifying a perseveration score that is higher when a subject shows a shallow rise or no improvement of performance after errors. Comparing of the perseveration score in blocks with the same versus novel objects than in the previous block estimates the vulnerability to ‘pro-active interference’ from the previous blocks target object (5).
Maze Game Task (M)
Purpose
The Visual-Spatial Maze Learning task tests how fast and accurate subjects learn new hidden trajectories in mazes of different complexities.
Description
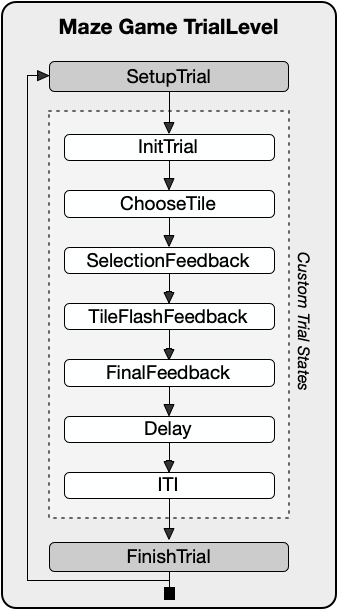
In this task, subjects start touching tiles of a 10×10 (or 6×6) grid and learn through trial-and-error which next tile horizontal or vertical tile relative to the previous tile is part of the longer pathway that leads an end position. Subjects search for the correct path until they reached the end point of the maze.
Task Demo
State Structure
Metrics
Performance of the Maze-Learning task provides four metrics. The average number of choices to complete a maze, normalized by the path length of the maze quantifies the speed of ‘spatial learning’ (1). The proportion of rule-breaking errors indexes ‘error monitoring for following a good strategy’ (2), while the proportion of erroneously repeating choosing the same incorrect tile reflects repetition errors used to evaluate ‘error monitoring for avoiding perseveration’ (3). Each maze is repeated with its unique context background and start-/end-position at 30-50 min after the initial learning of the maze. The difference in learning speed of the repeated versus initial maze evaluates ‘spatial memory’ (4).
Touch Hold Release Task (THR)
Purpose
The Touch-Hold-Release task (THR) teaches subjects to receive a reward for touching and holding an object for a specified duration.
Description
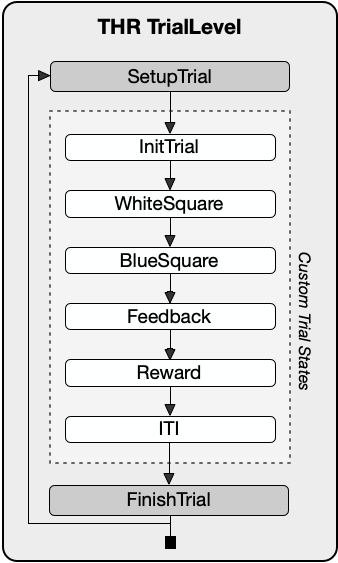
The task involves displaying a circle on the screen that blinks from white to blue. Touching the blue circle for the correct duration results in positive feedback. Touching the white circle, touching outside the circle, or touching the blue circle for the incorrect duration, will result in negative feedback.
Task Demo
State Structure
Metrics
Performance of the THR task is measured by the number of correct selections, and ensures subjects learn to touch and release visually displayed stimulus for a controlled duration.
Visual Search Task (VS)
Purpose
The Visual Search task measures how fast and accurate subjects are in detecting a target object among distractors.
Description
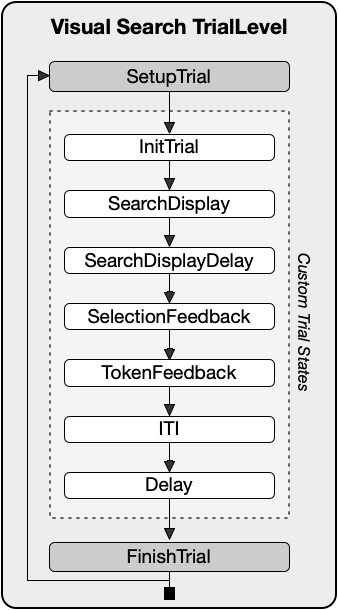
The task varies the numbers of distractors and the perceptual similarity of target and distractors using Quaddle-Objects that are composed of features from multiple visual dimensions (shapes, colors, patterns, etc.).
Task Demo
State Structure
Metrics
Performance of the Visual Search task provides four metrics. The accuracy and response time until target detection is quantified for each distractor condition and the reduction of accuracy and slowing of target detection with increasing numbers of distractors is fit with a linear regression model. The regression intercept corresponds to the target detection speed and indexes the ‘speed of processing’ (1), while the beta coefficient (slope) of the curve reflects how strong accuracy decreases with additional distractors with a shallower slope indexing better attentional filtering of distractions, i.e. ‘distractor interference control’ (2). A comparison of the search slope for the search displays with high versus low perceptual similarity of distractors and targets indexes ‘perceptual interference control’ (3). The difference of the intercept of the search slope for perceptually similar versus dissimilar objects reflects an overall skill of ‘visual discrimination’ (4).
Working Memory Task (WM)
Purpose
The Working Memory task tests how well subjects sustain visual feature information in working memory over a delay.
Description
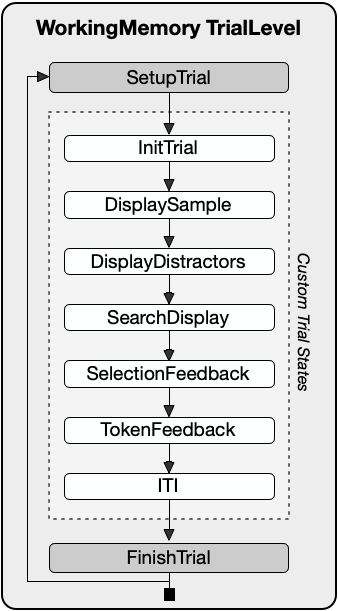
The task is a classical delayed-match-to-sample tasks with or without distracting objects during the delay. The task varies the complexity of objects, the similarity of the working memory probe object and the test objects, and the delay in milliseconds between probe and test objects.
Task Demo
State Structure
Metrics
Performance of the Delayed-Match-Sample Working Memory task provides three main metrics. The temporal delay that causes the first statistically significant decrement in accuracy relative to the shortest (0.25ms) delay estimates the ‘temporal persistence’ of working memory (1). The difference in average performance in trials with versus without distractor objects during the delay estimates the degree of ‘WM-interference control’ (2), which differs from the metrics ‘perceptual interference control’ that quantifies the accuracy decrease when the sample and test objects are multidimensional as opposed to one-dimensional.
What When Where Task (WWW)
Purpose
The WhatWhenWhere (WWW) task, also known as the Temporally Ordered Item-Item Paired Associate Learning task, tests how well subjects can learn sequential relationship between objects.
Description
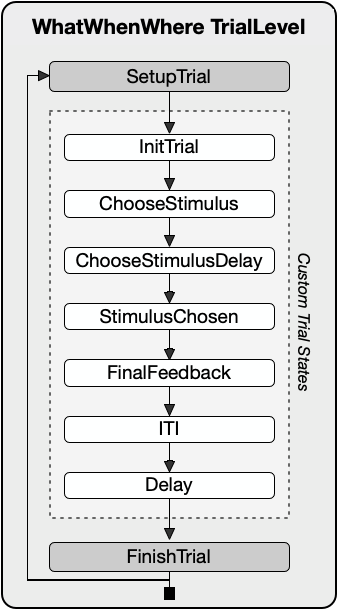
This task requires subjects to learn the temporal order of 5 or 7 objects presented simultaneous in individual trials at random locations. Performance of the task indicates how subjects chunk abstract visual feature information in working memory.
Task Demo
State Structure
Metrics
Performance of the WWW task provides four metrics. The average number of trials required to complete the four-order sequence corresponds to the ability of ‘object sequence learning’ (1), which involves forming object-object associations and chunking them into a sequence. Errors differ depending on whether an object from earlier positions is erroneously chosen again (repetition errors), or whether subjects chose the wrong object at a particular temporal position (slot errors). The proportion of repetition errors to all errors signifies the ability of ‘error monitoring/perseveration’ (2), while the proportion of slot errors indexes error monitoring/strategy following (3). Object sequences of the WWW task are accompanied by one distractor object that is irrelevant for the sequence, but which is similar to either the second or third object of the sequence it appears in. The number of distractor errors at the ordinal position at which the distractor was similar to the correct object is divided by all distractor errors to quantify how likely the distractor is confused with the correct object that specific to the ordinal position, i.e. it measures ‘temporal distractor interference’ (4). This ordinal positioning distractor effect is similar to the symbolic distance effect used in the literature to infer the learning of sequential relationships.